A Geek Takes A Look At The Fibonacci Pigeons
A few days ago the following photo was the subject of a Facebook post from Science Is Awesome. It purports to show a group of pigeons perched atop a train station platform roof in such a way that the spacing from one pigeon to then next follows a Fibonacci sequence.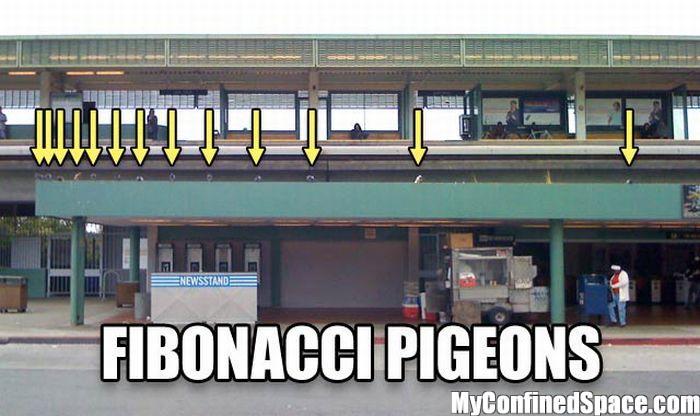
It is indeed awesome, showing yet another example of where the Fibonacci sequence can be found in nature – even if by a totally random occurrence. It is the sort of thing that makes my neurons tingle. However, being a photo and being found on the Internet makes it the sort of thing that also sets off my BS-detector. The first thought that came to mind was, It’s been Photoshopped! Thus I set out to determine the veracity of the photo and determine for myself if it was possibly true.
Before I delve into the details let’s quickly review the Fibonacci sequence just to give an idea of why it is exciting to math geeks like me.
Fibonacci discovered the sequence around 1202 in a thought experiment dealing with counting the number of pairs of rabbits that reproduced under the following rules. 1) You start with one new pair, male and female; 2) Each pair will always mate and yield another pair, also one male and one female; 3) Pairs will mate once per month; 4) A pair has to be at least a month old in order to mate.
Start with your new pair of rabbits and at the start of month One you have 1 pair. At the start of month Two you have the same pair and now they mate. Still 1 pair of rabbits. At the start of month Three they give birth to another pair and you have 2 pairs of rabbits. The original pair also mates again. At the start of month Four you then have the original pair, their first offspring pair, and a new pair – 3 pairs of rabbits. The original pair mates again, as does their first offspring pair. At the start of month Five you then have the original pair, their first and second offspring pairs, birth of their third offspring pair, and a pair from the second offspring – 5 pairs of rabbits. At this point you have to start drawing a diagram because it begins to get really complicated. If you do so, you’ll quickly see that the number of pairs of rabbits follows the sequence 1, 1, 2, 3, 5, 8, 13, 21, 34, 55, 89, 144, 233, … the Fibonacci sequence.
Of course this isn’t how rabbits really reproduce. For starters, it require siblings to mate (Fibonacci did not know about genetics) but it was enough to give some idea of how rabbit populations explode as quickly as they do.
If you look at the sequence you quickly realize that after the first two numbers each subsequent number is the result of simply adding the previous two. Modern mathematicians like to start the sequence at zero, so the rule for generating the Fibonacci sequence is
F(n) = F(n-2) + F(n-1)
with seed numbers F(0) = 0 and F(1) = 1.
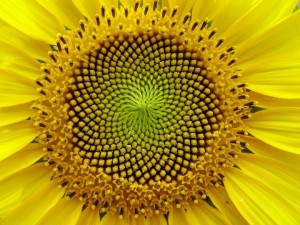
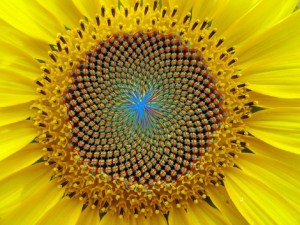
What is surprising is when this sequence appears in nature. In botany, phyllotaxis deals with how plants arrange their leaves around a stem in an effort to maximize the amount of sunlight received for each leaf. They do this, as you may have guessed by now, in a pattern that produces the Fibonacci sequence. Sunflowers arrange their seeds in such a way that two sets of spirals are produced.
If you count the number of spirals going counter-clockwise (red lines) and then count the number of spirals that turn clockwise (blue lines) you will find that they are adjacent Fibonacci numbers. In the image below there are 34 counter-clockwise spirals and 55 clockwise spirals. Click on the image for a larger version if you want to count the lines yourself.
This is not limited to sunflowers. The fruitlets appearing on the skin of a pineapple, the flowering of an artichoke plant, the seed arrangements of a pine cone, and the branching pattern of trees all follow Fibonacci sequences.
Amazing, no?
Now back to the photo of the pigeons above. A quick glance, aided by the addition of the arrows, appears to show that they have perched themselves in such a way that the distances between them follow the Fibonacci sequence. I wanted to check to see if the image was Photoshopped. I usually save the image to my computer and open it up in an image editor (I use Photoshop, in fact) and magnify it as much as possible to look at individual pixel groupings. This makes it obvious which parts of an image have been added or altered in the case of quickly ‘shopped photos. If that fails, I can look at abrupt changes in contrast, tonal values, etc, to see if parts of the image have been altered. It isn’t exactly scientific, more of an aesthetic poking around.
This didn’t work in the case of the pigeon photo because the original image posted was already a copy of someone else’s copy of some original. That’s the way it is on the Internet – the original source has been lost to obscurity and I could not find a large unaltered image to examine. Time to get more scientific about this.
Those of you who read posts (A Geek Explores Nutrition Aspects Of Cycling) know that I love to play with numbers and graphs.
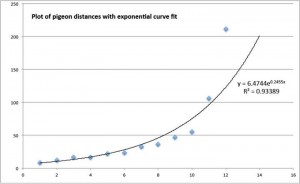
Using the largest image I could find of the pigeon photo (700×416 pixels) I proceeded to grab the pixel coordinates of each pigeon. Actually, I only needed the x-coordinate of each pigeon. With that data I could then plot the change in distance from one pigeon to the next. This is shown in the graph below along with a best exponential curve fit that tries to reproduce the data (solid line).
The graph is interesting. The R-squared value of the fit is a measure of how close the data fits the curve. If the curve exactly reproduced all the data points R-squared would be 1. The further away from 1, the less accurate the curve fits the data. Here the value of R-squared is 0.93, so this curve is not great, but not terribly bad either. One would think that if the image were Photoshopped it would have exactly followed the Fibonacci sequence.
Another feature of the Fibonacci sequence reveals that this photo is probably not fake but neither do the pigeons space themselves apart in an effort to follow the sequence. You see, as the sequence progresses it turns out that each Fibonacci number is larger than the one before it by an amount equal to the Golden Ratio. (Yet another surprising link between two famous quantities in mathematics!) In other words,
F(n) ~ Φ x F(n-1),
where Φ is the golden ratio, 1.6180….
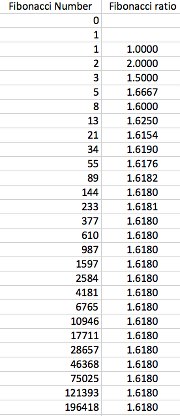
To see this look at the next chart. It lists the first 28 Fibonacci numbers and lists the ratio of them to the previous number.
This number rapidly approaches the golden ratio (to the number of digits shown) and gets progressively better as the series grows. What this means is that any Fibonacci number can be (approximately) generated by some power of the golden ratio. That is,
F(n) = C x Φ x F(n-1)
= C x Φ x Φ x F(n-2) = . . . C x Φ^n,
for some unknown coefficient C. We aren’t really interested in C but in plotting any sequence of numbers that follows the Fibonacci sequence we expect that the curve that fits the data points should be a power law function with the base Φ = 1.6180.
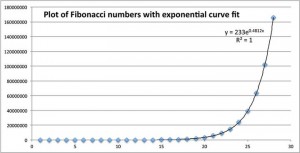
The next plot is a plot of the Fibonacci numbers (skipping the first few ones) along with an exponential curve that fits them nearly perfectly.
exp( 0.4812 x ) = exp( x ln(Φ) )
using the relation Phi^x = exp( x ln(Φ) ), where ln is the natural logarithm.
So ln(Φ) = 0.4812, or Φ = exp( 0.4812 ) = 1.6180, our golden ratio again.
Now look back at the curve fit for our pigeon data. Here we have
ln(Φ) = 0.2455, or Φ = 1.278.
Clearly these pigeons know nothing about the Fibonacci sequence.
And now you know more than you probably cared.

Recent Comments